How much can we learn about Greater Montréal’s real estate structure from assessed land and building values alone?
Greater Montreal area · 4 figures · ≈ 6 min core read · 2026
In 30 seconds
1. Once aggregated and mapped, municipal assessment-roll data becomes a territorial intelligence layer that can enrich early-stage opportunity analysis.
2. Land and building values broadly overlap, but their differences reveal distinct territorial structures.
3. Compared over time using harmonized vintages, the same framework could help reveal corridors where assessed value is increasing more rapidly.
01 - THE STARTING POINT
Mapping the assessment roll: value concentration
Municipal assessment rolls are generally approached as administrative and fiscal records. But because each property record is tied to a location, the roll can also be aggregated and mapped as a source of territorial intelligence.
This first map shows where the assessed property base accumulates. But it does not answer another important question: what is that value made of?
Two places can contain the same total assessed value while representing different conditions. In one, most value may be attributed to existing buildings. In the other, land may account for the larger share.
Using Québec’s municipal assessment-roll data aggregated into a 500-metre hexagonal grid, we can separate total assessed value into its land and building components. Doing so allows us to recombine magnitude and composition to identify four broad real estate regimes.
The objective is not to produce an investment-opportunity map. It is to determine what territorial structure can be detected from assessed values alone—and how this information can enrich the initial screening that precedes more detailed market, planning or site-level analysis.
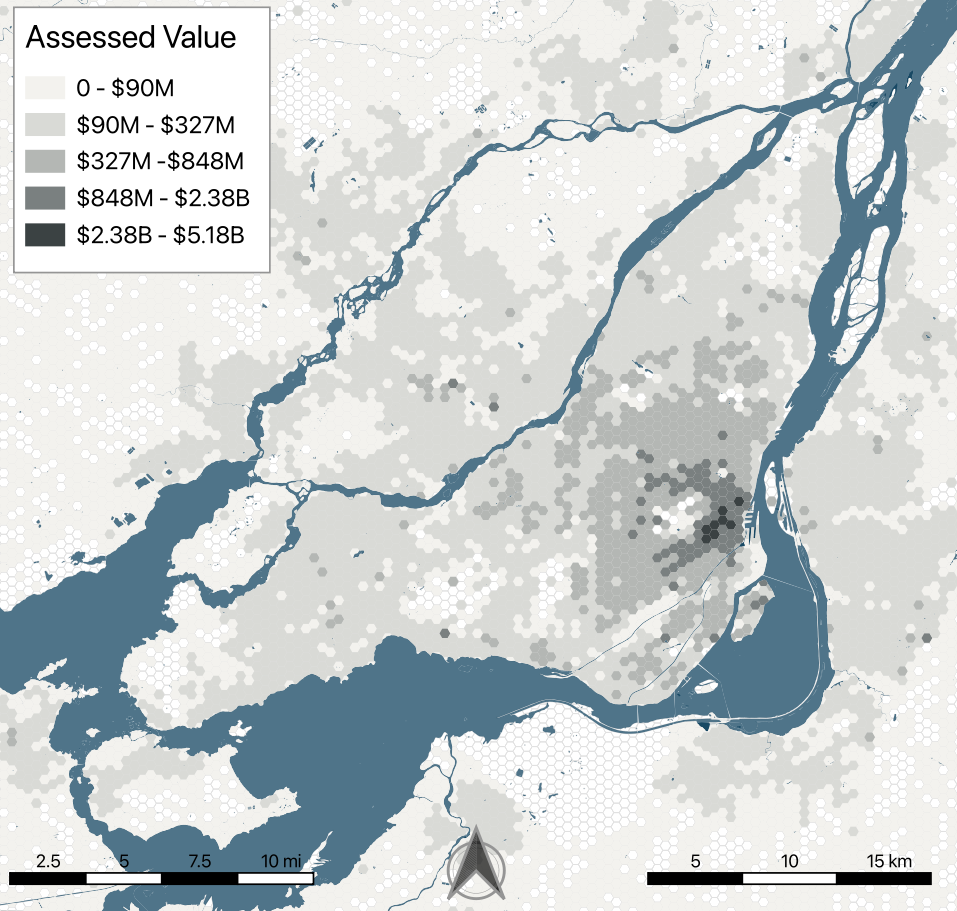
Figure 1 - Where assessed value concentrates. Values represent the sum of assessed land and building values in each hexagon.
Concentration analysis
A major concentration appears across the central metropolitan territory. Secondary concentrations emerge around established urban nodes and development corridors, while intensity generally diminishes toward the periphery.
This recognizable pattern combines the number of assessed properties, the scale and value of buildings and the value attributed to land.
A dark hexagon does not mean that every property inside it is expensive. It means that a large amount of assessed value has accumulated within that spatial unit. Total value therefore describes concentration, but not pricing, liquidity, development capacity or expected return.
The map is best understood as a territorial baseline: it identifies where the assessed property base is concentrated before other dimensions of opportunity are introduced.
02 · decompose the total
Components of value : land and buildings
Total assessed value reveals concentration. Separating it into land and building components helps reveal the territorial structure behind that concentration.
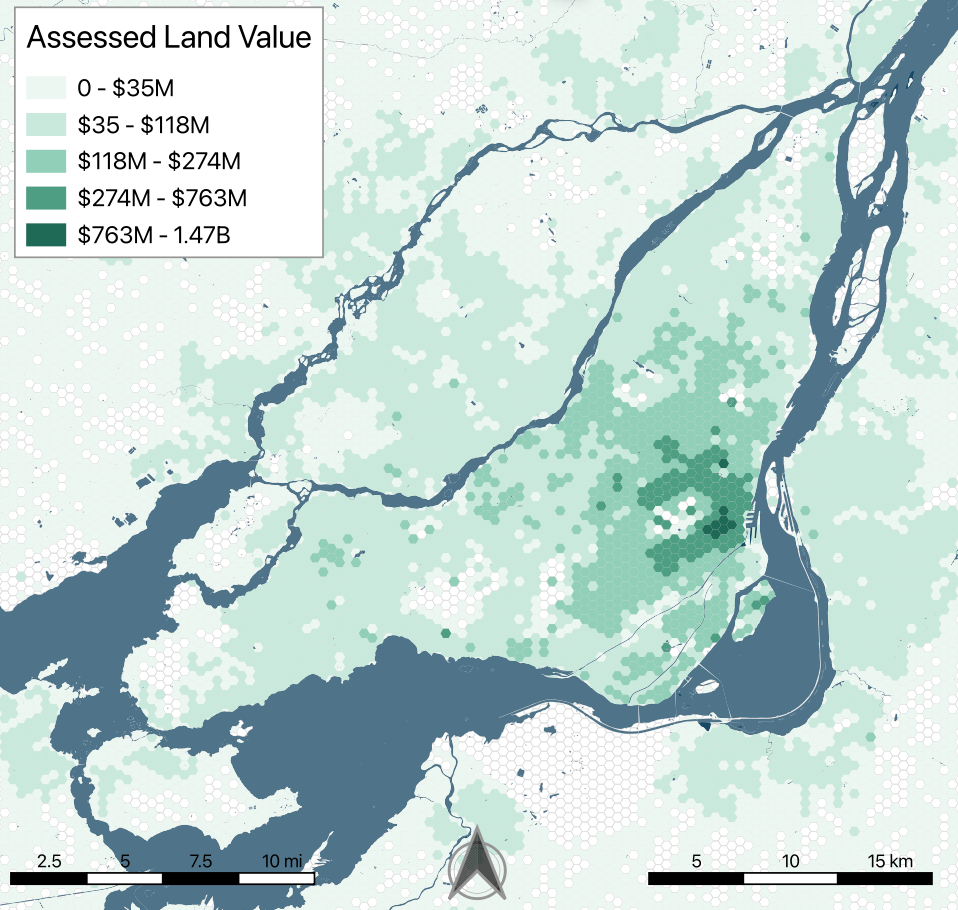
Figure 2 - Assessed land value.
The map represents the sum of assessed land values within each hexagon.
The land component may reflect accessibility, parcel size, permitted uses and neighbourhood positioning.
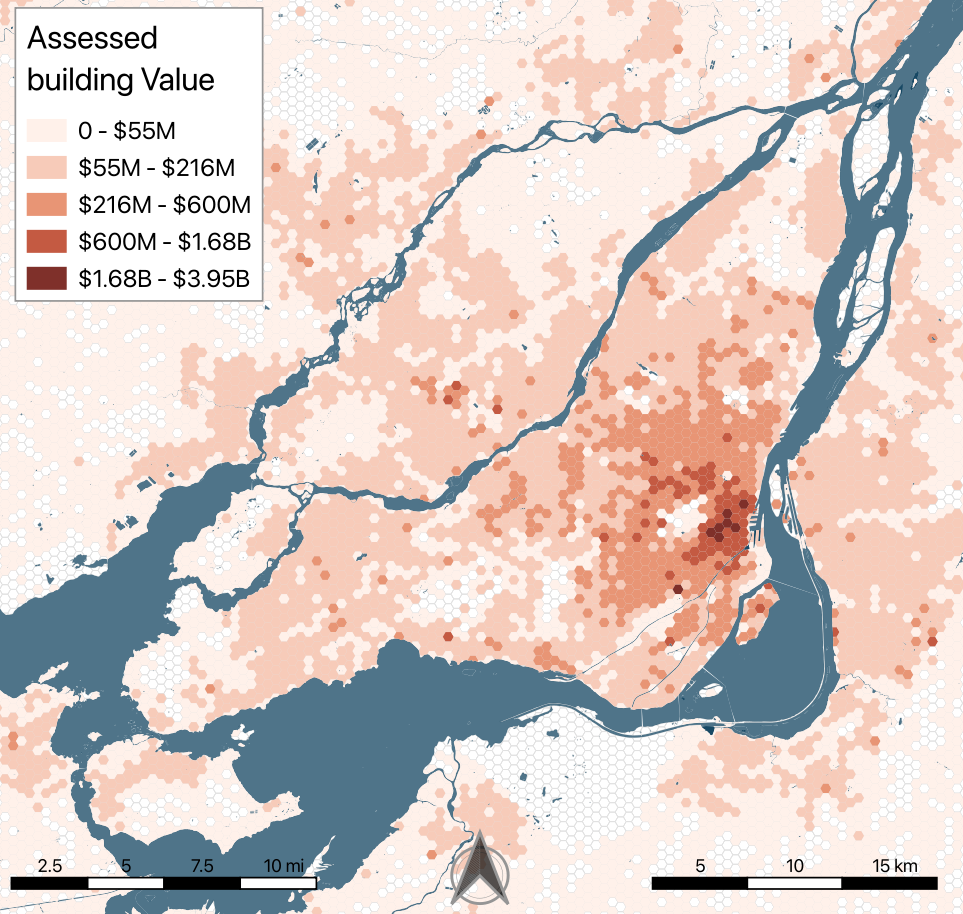
Figure 3 - Assessed building value.
The map represents the sum of assessed building values within each hexagon.
It should not be read as a direct measure of building density.
At the metropolitan scale, the land and building maps look broadly similar. That similarity makes sense: across much of Greater Montréal, valuable land and valuable buildings coexist.
Highlighting where they differ is more useful. A hexagon may derive high building value from many properties, several major buildings or high-density development. A land-heavy cell may instead contain large residential parcels, commercial or industrial land, public facilities or specialized ownership conditions.
A good example of that difference is Town of Mount Royal, with its relatively large residential parcels and comparatively high land component. It appears as high-value and land-led in the next map.
Separating the components allows the analyst to ask whether comparable totals are being produced through comparable real estate structures.
03 · recombine the evidence
From concentration to real estate regimes
Figure 4 - Value composition quadrants.
High-value hexagons represent the top 10% of cells with complete data—approximately $260 million or more per hexagon.
High value / Building-led
Total value > $260M, with buildings as largest component.
High value / Land-led
Total value > $260M, with land as largest component.
Lower value / Building-led
Total value < $260M, with buildings as largest component.
Lower value / Land-led
Total value < $260M, with land as largest component.
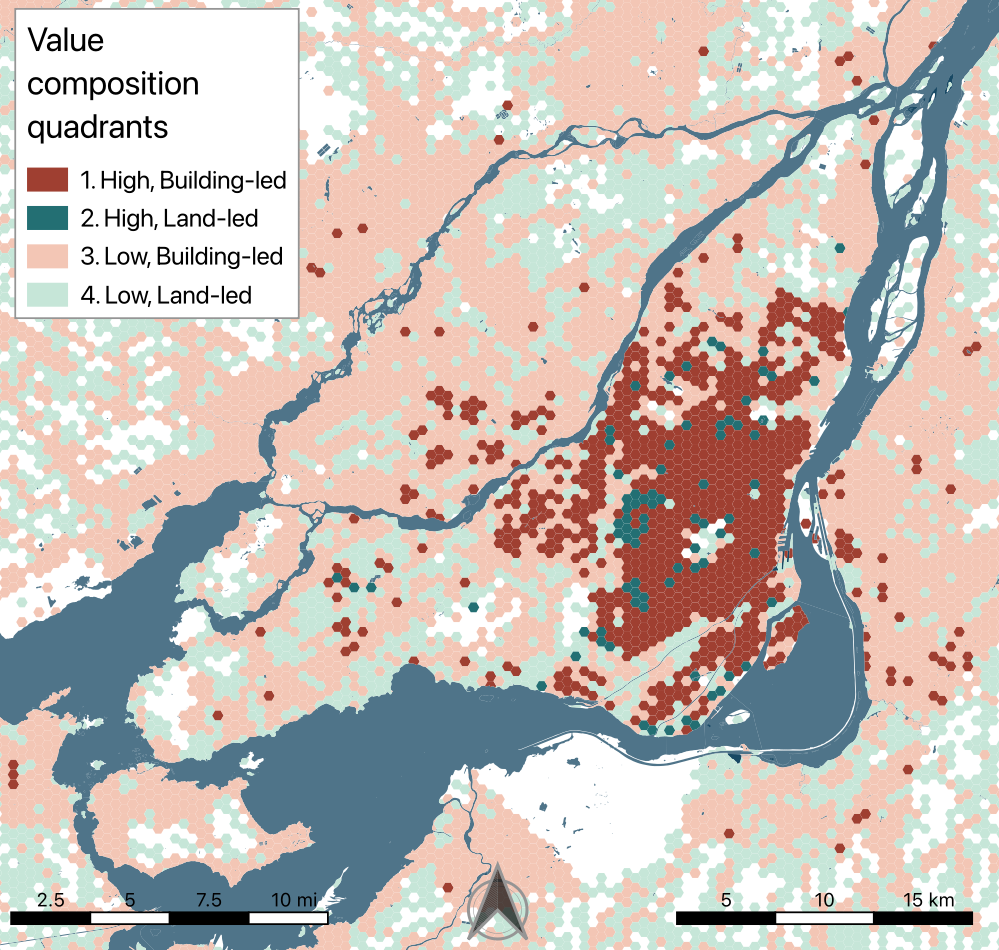
“Lower value” is relative to the metropolitan distribution. It does not mean valueless or unimportant.
High-value, building-led cells form the dominant concentration across the central metropolitan territory.
High-value, land-led cells are rarer and less continuous. At first glance, they appear commercially provocative: valuable territory with comparatively less value attributed to buildings. Closer inspection changes that interpretation.
Many overlap with parks, schools, transportation infrastructure, institutional properties or other specialized conditions. Their profile may reflect an urban use with limited assessed building value, public or exempt property, or the combination of several uses within a 500-metre cell.
A more continuous pattern appears in places such as Town of Mount Royal, where expensive land, relatively large parcels and comparatively limited built intensity may combine differently. Residential character, parcel structure, planning controls and market positioning may all contribute.
The quadrant map is valuable because it prevents all high-value territories from being treated as the same real estate condition. It does not identify opportunities directly, but it reveals where different hypotheses should be investigated.
04 · INTERPRET WITH RESTRAINT
Value composition quadrants: uses, limits and future applications
These readings can support metropolitan screening and improve the questions asked at the beginning of site selection, planning or due diligence.
Mapped assessment-roll data can help an analyst compare territories using a common framework, distinguish different compositions of assessed value and identify unusual spatial patterns. These signals can then guide more targeted research into parcels, ownership, transactions, zoning, infrastructure or development activity.
They cannot determine whether a property is available, transformable, profitable or desirable.
Assessment data does not directly describe transaction prices, market liquidity, ownership intentions, zoning capacity, infrastructure or environmental conditions. Spatial aggregation adds another limitation: each hexagon can combine properties and uses that would be interpreted differently at parcel level.
Land-led does not mean underused.
It describes the composition of assessed value; it does not explain whether that composition results from development optionality, specialized use, public ownership, planning restrictions, infrastructure or a data anomaly.
The quadrants highlight the kind of value that is already present.
From a static picture to signals of change
The present analysis represents a static picture. A future iteration could compare harmonized assessment-roll vintages using the same geographic grid. This would make it possible to examine changes in total value and in the relative contributions of land and buildings.
Rather than focusing only on individual cells, the analysis could look for continuous sequences of cells where assessed value is progressing more rapidly than in surrounding territories. Such patterns might reveal emerging axes or corridors of assessed-value growth and help direct more detailed investigation.
These signals would need to be interpreted carefully. Changes may result from reassessment cycles, new construction, property modifications or administrative updates—not only from underlying market appreciation. A temporal analysis would therefore require harmonized reference dates and additional market and planning evidence.
Repeated over time, the same framework could begin to show where the geography of assessed value is changing.
The assessment roll is not a substitute for opportunity analysis. Once mapped, however, it becomes a structured territorial layer capable of making that analysis more focused and better informed.
Method in brief
500 m hexagons · Municipal assessment roll · Top 10% threshold ≈ $260 million · Incomplete cells excluded
Property-assessment records were aggregated into a common 500-metre hexagonal grid covering the broader Montréal region. For each populated cell, the analysis calculated total assessed value, assessed land value and assessed building value. Cells with incomplete components were excluded from the four-regime classification.
“High value” was defined as the top 10% of valid cells by total assessed value, corresponding to approximately $260 million or more per hexagon. A cell was classified as building-led when building value was equal to or greater than land value, and land-led when land value was greater.
Limits to interpretation
The threshold is relative to this dataset and grid—not a universal benchmark. Values are aggregated sums rather than averages per property or per unit of land. Assessed values are administrative valuations, not observed transaction prices.
Results also depend on source completeness, geolocation, assessment practices and reference dates. The analysis should be understood as metropolitan screening—not financial, planning or legal due diligence.
Sources
- Québec 2026 municipal assessment-roll data - https://www.donneesquebec.ca/recherche/dataset/roles-d-evaluation-fonciere-du-quebec
- SpaceLab 500-metre metropolitan hexagonal grid.
- Hydrography and contextual layers — OpenStreetMap.
- Analysis and cartography: SpaceLab | NextSpaceStrategy, 2026.

About Nicolas DELFORGE
Founder, NextSpaceStrategy
Nicolas Delforge is an independent real estate, GIS and IWMS consultant with more than 20 years of experience connecting spatial evidence, development decisions and real estate operations.